Monitoring stack#
KubeStack+ supports all four levels in service monitoring maturity model.
Service Monitoring Maturity Model#
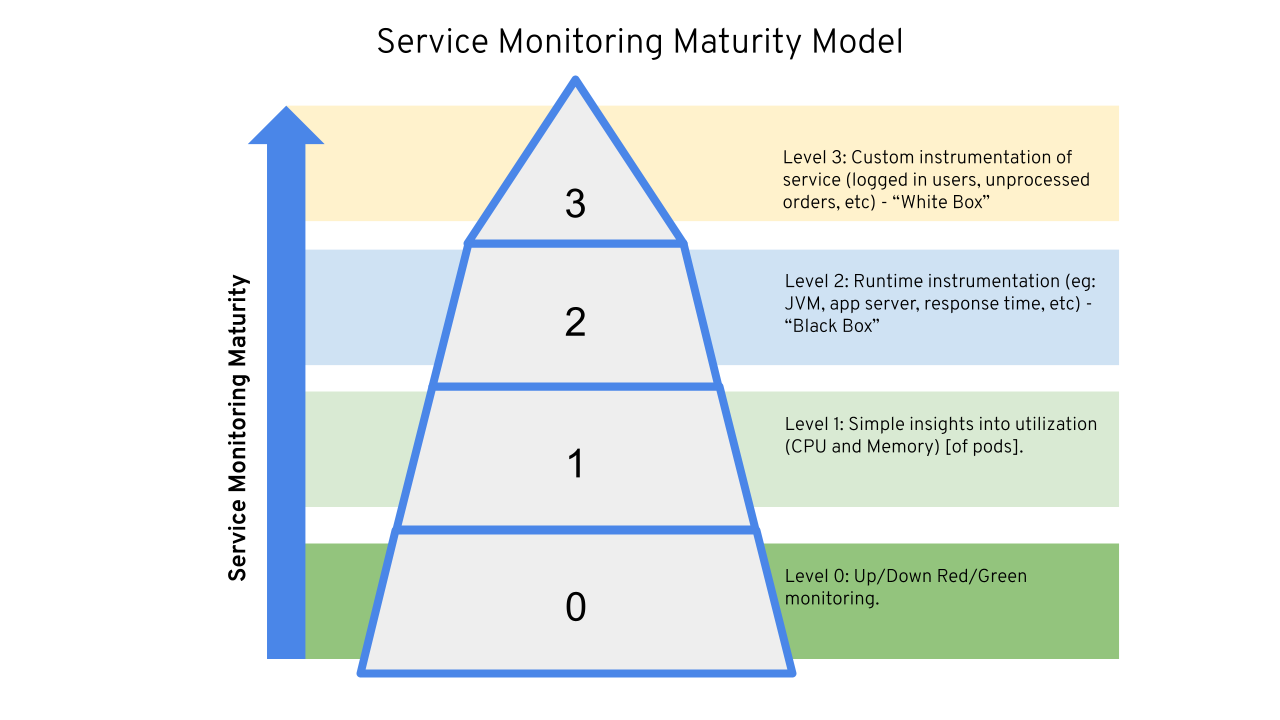
Level 0#
Level 0: Up/Down Red/Green monitoring.
Level 1#
Level 1: Simple insights into utilization (CPU and Memory) of pods.
Level 2#
Level 2: runtime instrumentation (JVM, app server, response time, etc) -“Black Box”.
Level 3#
Level 3: Custom instrumentation of service (logged in users, unprocessed orders, etc) -“White Box”.
Components#
KubeStack+ uses the LGTM stack for a unified observability experience:
- Grafana — unified dashboards for metrics, logs, and traces
- Mimir — scalable, long-term metrics storage
- Loki — log aggregation and querying
- Tempo — distributed tracing
- Alertmanager — alert routing and notifications