Create Grafana Dashboard Guide#
This document explains how to create Grafana Dashboard via GrafanaDashboard CR powered by Grafana operator. In this way there is no need to configure/import it via web UI. Now, developers can ship new dashboards in any namespace and deploy them via GitOps. If Dashboard definition/JSON is invalid, the dashboard will not appear in Grafana web UI.
Prerequisite#
- Grafana should be up and running. You should be able to find it under Workload Monitoring category in your Forecastle link.
Instructions#
-
Create GrafanaDashboard definition
You can choose any existing namespace. The label
grafanaDashboard: grafana-operatoris required for Grafana Operator to discover the dashboard. The JSON string with the dashboard contents is placed in thejsonsection. Check the official documentation for details on JSON Model. You can create a dashboard via web UI first, and then export the dashboard JSON to define a GrafanaDashboard CR (Custom Resource). If the JSON is invalid, the dashboard will not appear in Grafana web UI. Below is a sample GrafanaDashboard CR YAML.apiVersion: integreatly.org/v1alpha1 kind: GrafanaDashboard metadata: name: grafana-dashboard-example namespace: test-ns labels: grafanaDashboard: grafana-operator spec: json: |- { "annotations": { "list": [ { "builtIn": 1, "datasource": "-- Grafana --", "enable": true, "hide": true, "iconColor": "rgba(0, 211, 255, 1)", "name": "Annotations & Alerts", "type": "dashboard" } ] }, "editable": true, "gnetId": null, "graphTooltip": 0, "id": null, "links": [], "panels": [ { "aliasColors": {}, "bars": false, "dashLength": 10, "dashes": false, "datasource": null, "fieldConfig": { "defaults": {}, "overrides": [] }, "fill": 1, "fillGradient": 0, "gridPos": { "h": 9, "w": 12, "x": 0, "y": 0 }, "hiddenSeries": false, "id": 2, "legend": { "avg": false, "current": false, "max": false, "min": false, "show": true, "total": false, "values": false }, "lines": true, "linewidth": 1, "nullPointMode": "null", "options": { "alertThreshold": true }, "percentage": false, "pluginVersion": "7.5.11", "pointradius": 2, "points": false, "renderer": "flot", "seriesOverrides": [], "spaceLength": 10, "stack": false, "steppedLine": false, "thresholds": [], "timeFrom": null, "timeRegions": [], "timeShift": null, "title": "Panel Title", "tooltip": { "shared": true, "sort": 0, "value_type": "individual" }, "type": "graph", "xaxis": { "buckets": null, "mode": "time", "name": null, "show": true, "values": [] }, "yaxes": [ { "format": "short", "label": null, "logBase": 1, "max": null, "min": null, "show": true }, { "format": "short", "label": null, "logBase": 1, "max": null, "min": null, "show": true } ], "yaxis": { "align": false, "alignLevel": null } } ], "schemaVersion": 27, "style": "dark", "tags": [], "templating": { "list": [] }, "time": { "from": "now-6h", "to": "now" }, "timepicker": {}, "timezone": "", "title": "New dashboard", "uid": null, "version": 0 } -
Apply GrafanaDashbaord CR to your cluster, manually or via GitOps way
-
View the dashboard via Grafana web UI
- Under
stakater-workload-monitoringproject, find the URL to Grafana through Cluster menu [Networking]->[Routes] -
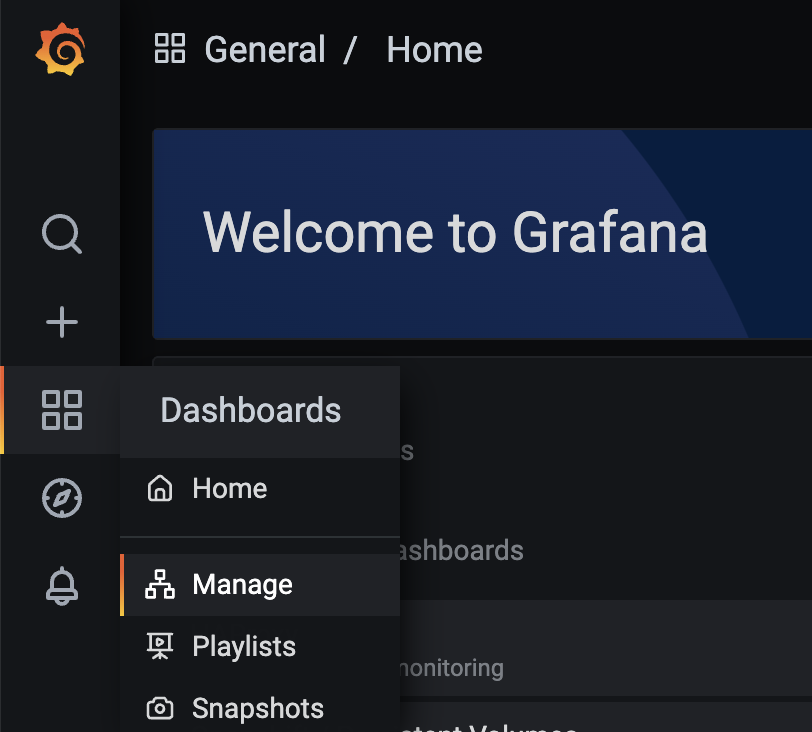
Open Grafana web UI, and go to [Dashboards]->[Manage] to view Dashboards management page

-
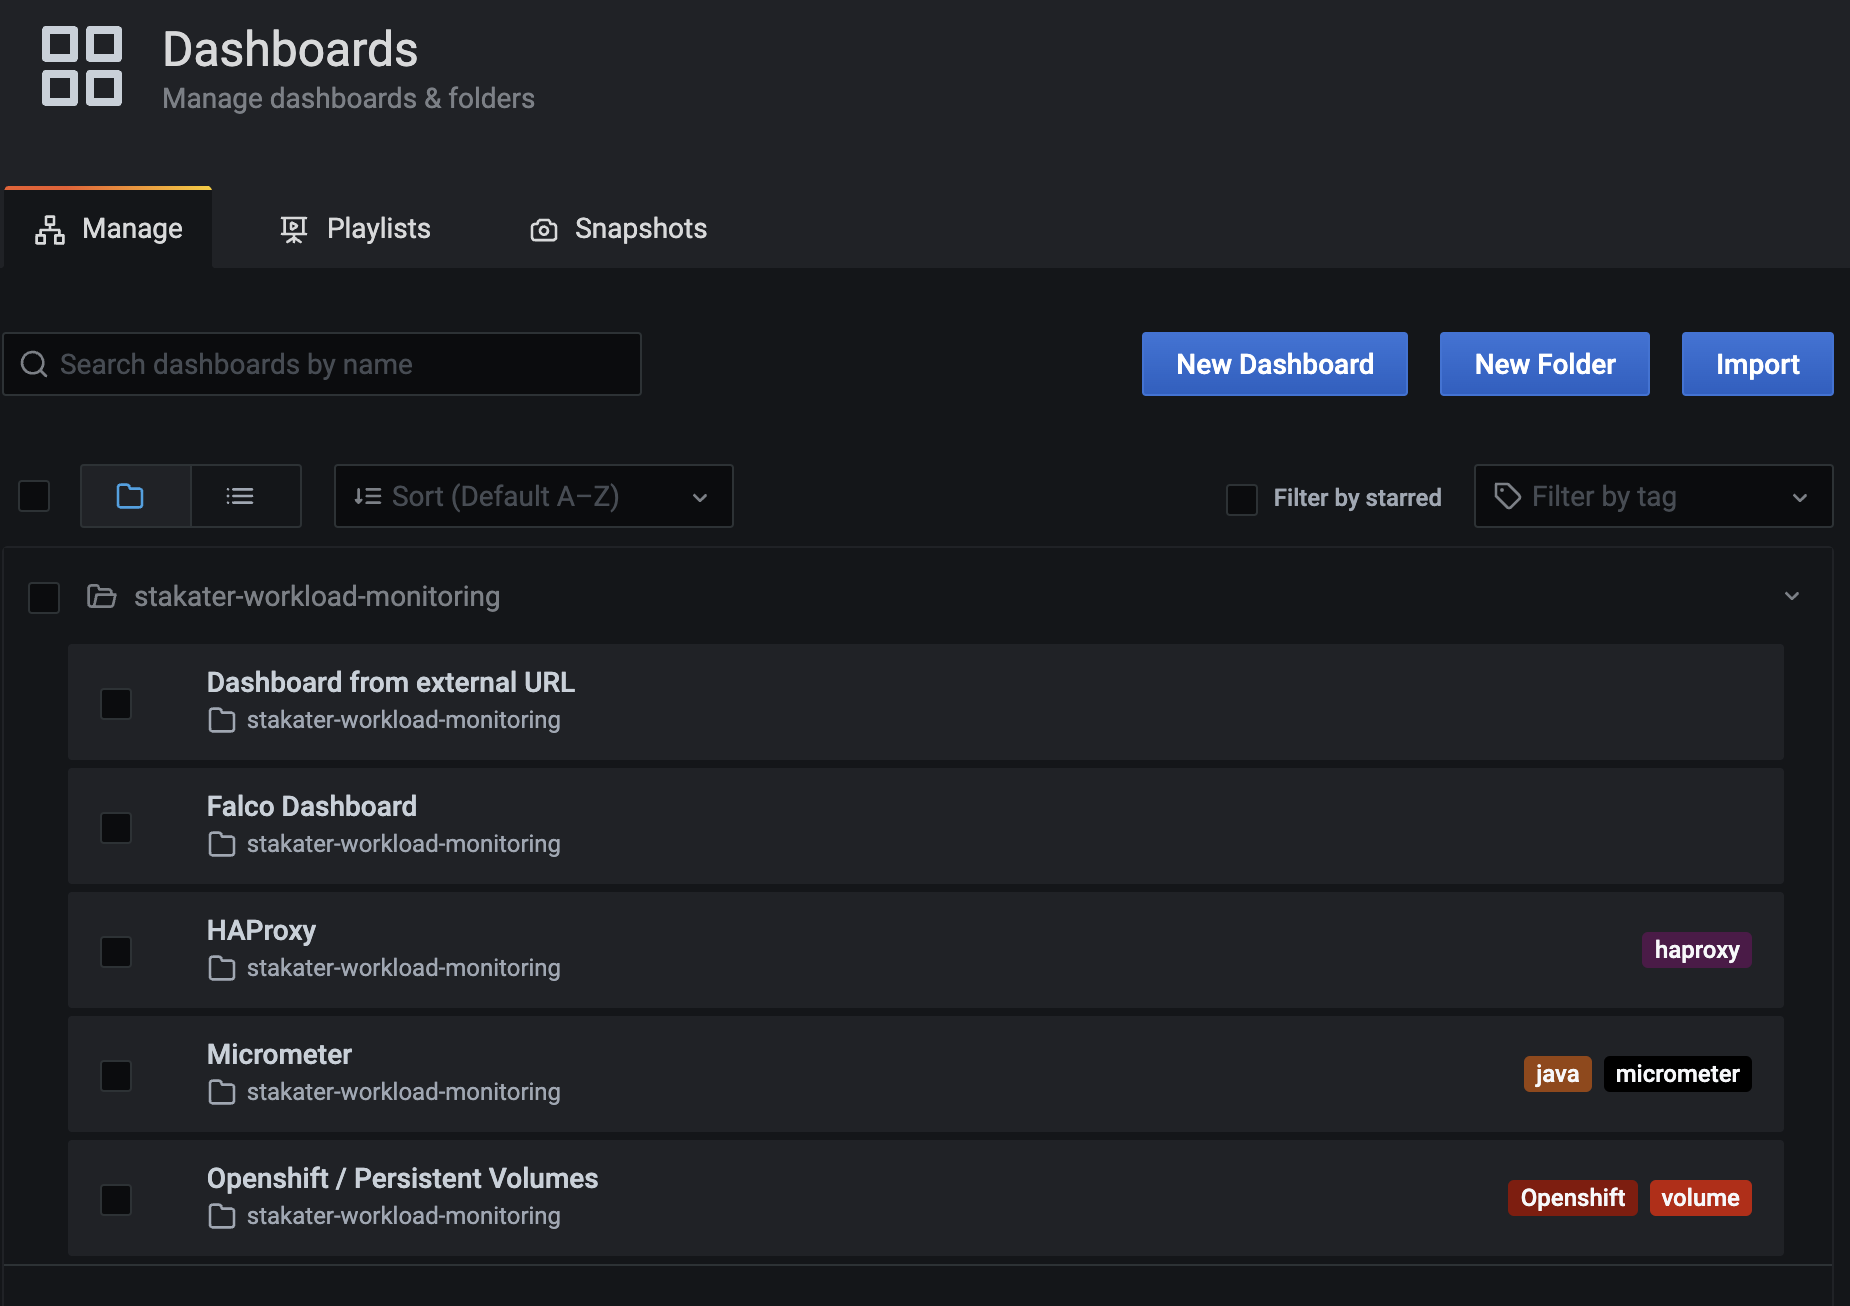
Your dashboard will be put in a folder named after the namespace that you specified in GrafanaDashboard definition. The following is an example.

- Under
Application chart#
A template for installing GrafanaDashboard is provided by application chart. You are able to specify configuration via values.yaml and install dashboards on cluster. The following is an example.